
Solar cycle statistics 2026
The international sunspot number averaged 45.7 in October 2026, according to WDC-SILSO at the Royal Observatory of Belgium, as published by the NOAA Space Weather Prediction Center. Below are 44 key statistics on Solar Cycle 25: the latest figures, the cycle's highs so far, a comparison with Cycle 24, yearly averages, records and long-run figures, each calculated from the official monthly data and linkable on its own.
Updated 2 November 2026. Source: NOAA Space Weather Prediction Center; WDC-SILSO, Royal Observatory of Belgium. Monthly chart and full data: Solar Cycle 25 tracker. Look up any month or year since 1749: Sunspot cycle lookup. Compare cycles at the same stage: Solar cycle comparison. Download these figures: key figures (CSV) · by year (CSV).
Latest figures
- The international sunspot number averaged 45.7 in October 2026, according to WDC-SILSO at the Royal Observatory of Belgium, as published by the NOAA Space Weather Prediction Center. #
- The 10.7 cm solar radio flux (F10.7) averaged 108.5 solar flux units in October 2026. #
- The sunspot number fell 14.6 from 60.3 in September 2026. #
- A year earlier, in October 2025, it averaged 114.8, so monthly sunspot activity is 60.2% lower than twelve months ago. #
- Over the last twelve months the monthly sunspot number has ranged from 45.7 (October 2026) to 124.2 (December 2025). #
- The 12-month average sunspot number to October 2026 is 85.8, down from 131.2 a year earlier. #
- October 2026 was the lowest monthly reading since November 2021, when the sunspot number was 34.8. #
- The latest monthly value is 78.8% below the Solar Cycle 25 monthly high of 216.0 recorded in August 2024. #
Solar Cycle 25
- Solar Cycle 25 began in December 2019, the solar minimum identified by the NOAA–NASA Solar Cycle 25 Prediction Panel; the monthly sunspot number that month was 1.5. #
- The highest monthly sunspot number of Solar Cycle 25 so far is 216.0, in August 2024, 56 months after the cycle began. #
- The highest monthly F10.7 radio flux of the cycle so far is 245.6 solar flux units, in August 2024. #
- Using the standard 13-month smoothed sunspot number, the highest value of Solar Cycle 25 so far is 160.9, centred on October 2024, by PolarisWire's calculation from the monthly figures. #
- The most recent 13-month smoothed value, centred on April 2026, is 88.6, 44.9% below that high. #
- Across the 83 months of Solar Cycle 25 to October 2026, the sunspot number has averaged 85.7. #
- The monthly sunspot number has been 100 or higher in 35 months of Solar Cycle 25, first in December 2022 and most recently in May 2026. #
- The monthly sunspot number has been 150 or higher in 10 months of Solar Cycle 25, first in June 2023 and most recently in February 2025. #
- The monthly sunspot number has topped 200 in only one month of Solar Cycle 25: August 2024. #
Cycle 25 compared with Cycle 24
- Solar Cycle 24, which began in December 2008, reached a monthly high of 146.1 in February 2014. #
- Its highest 13-month smoothed sunspot number was 116.4, centred on April 2014. #
- Solar Cycle 25's smoothed high so far is 38.2% above Cycle 24's, and its highest month is 47.8% above Cycle 24's. #
- Over the first 83 months of each cycle, Cycle 25 averaged 85.7 against 66.8 for Cycle 24 (to October 2015). #
- Over its full 132 months, from December 2008 to November 2019, Cycle 24 averaged a monthly sunspot number of 49.5. #
- The sunspot number was below 10 in 22 of the 24 months of 2008–2009 and in 30 of the 36 months of 2018–2020, the two solar minimums in this record. #
Sunspot number by year
- 2026 so far: the sunspot number has averaged 81.3 across 10 months, against 123.5 in 2025; F10.7 has averaged 126.8 sfu. #
- 2025: average sunspot number 123.5, average F10.7 flux 154.6 sfu. #
- 2024: average sunspot number 154.5, average F10.7 flux 190.7 sfu. #
- 2023: average sunspot number 125.3, average F10.7 flux 159.9 sfu. #
- 2022: average sunspot number 83.0, average F10.7 flux 124.6 sfu. #
- 2021: average sunspot number 29.5, average F10.7 flux 81.8 sfu. #
- 2020: average sunspot number 8.8, average F10.7 flux 73.8 sfu. #
- 2019: average sunspot number 3.6, average F10.7 flux 69.7 sfu. #
- 2018: average sunspot number 7.0, average F10.7 flux 69.9 sfu. #
- 2017: average sunspot number 21.8, average F10.7 flux 77.5 sfu. #
- 2016: average sunspot number 39.8, average F10.7 flux 88.9 sfu. #
- 2015: average sunspot number 69.8, average F10.7 flux 118.0 sfu. #
Records since 2008
- The highest monthly sunspot number since January 2008 is 216.0, in August 2024. #
- The lowest is 0.0, in August 2009. #
- The highest monthly F10.7 flux since January 2008 is 245.6 sfu (August 2024); the lowest is 65.7 sfu (July 2008). #
- The most active calendar year since 2008 was 2024, with an average sunspot number of 154.5; the quietest was 2019, at 3.6. #
- The largest one-month rise in the sunspot number was +59.9, in October 2013. #
- The largest one-month fall was −74.9, in September 2024. #
Long-run figures
- The monthly sunspot number has averaged 60.6 since January 2008, and F10.7 flux 108.2 sfu. #
- Monthly sunspot numbers and F10.7 flux move closely together: their correlation over 226 months since January 2008 is 0.97. #
- The figures on this page draw on 226 monthly readings from January 2008 to October 2026. #
Download chart
A ready-to-use image of the average monthly sunspot number in each year from 2008 to 2025, covering Solar Cycle 24 and Solar Cycle 25 so far, with the source credit printed on the chart. It is updated daily with this page.
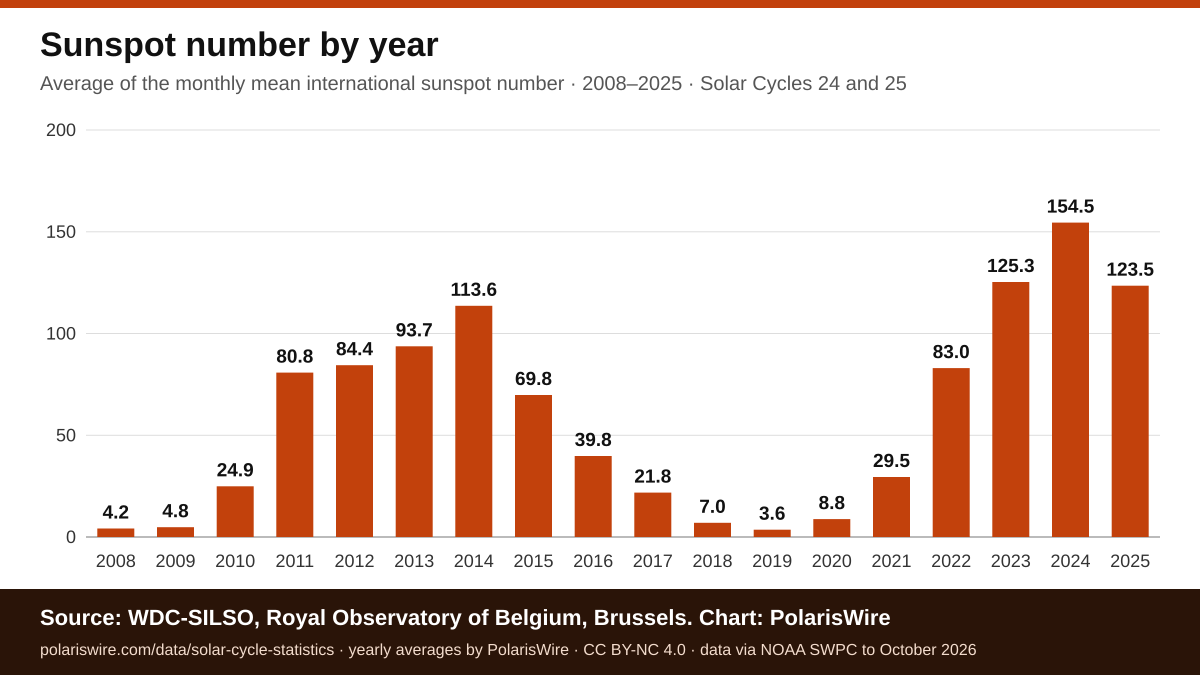
Download chart (PNG, 1200 × 675 px) · SVG version
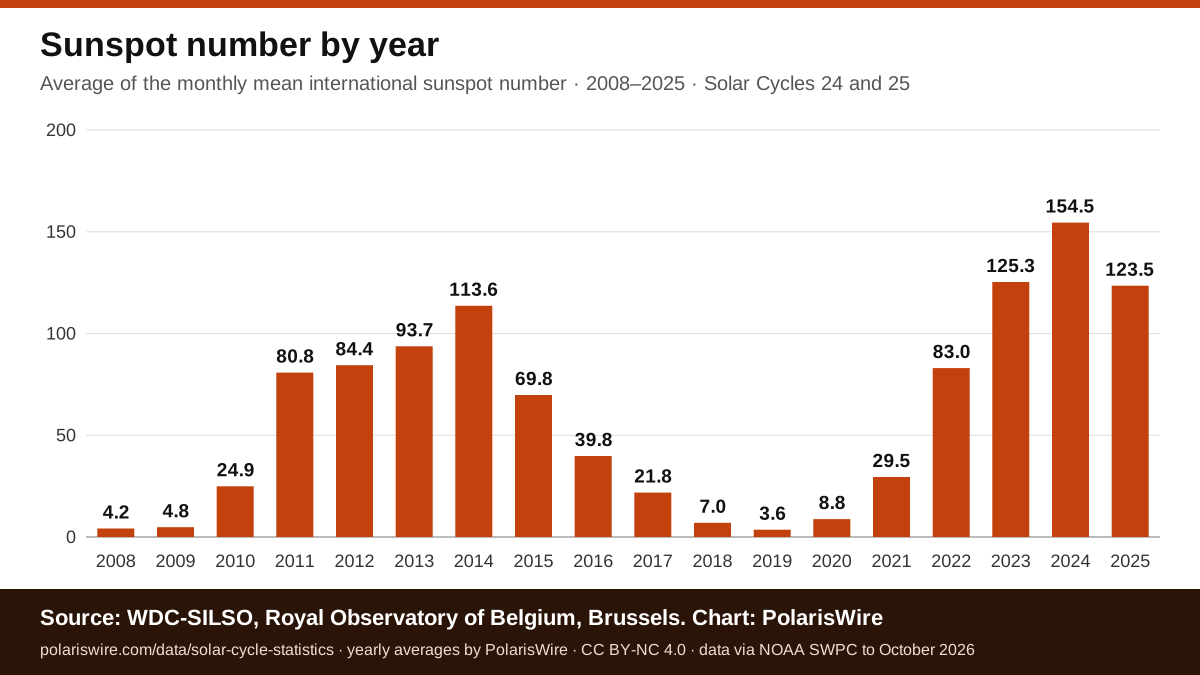
Each bar is the average of the twelve monthly mean international sunspot numbers in that complete calendar year, calculated by PolarisWire (the same figures as the average column in the by-year CSV below, rounded to one decimal place); the current year is left out until all twelve months are in. SILSO may revise recent months, so the latest bars can change. The sunspot numbers come from WDC-SILSO, Royal Observatory of Belgium, under a CC BY-NC 4.0 licence (SILSO data policy), so the chart is offered on the same terms: you may reuse it for non-commercial purposes with credit to PolarisWire and WDC-SILSO, Royal Observatory of Belgium, and a link to this page. Commercial use is not covered. Please keep the credit line on the image. To publish it, copy this code:
Download the data
The figures on this page are free to download as CSV files, built from the same SILSO and NOAA data as the page and updated daily with it:
- Solar cycle statistics key figures (CSV): all 44 statistics above, with the value, unit, period, full statement and a direct link to each figure.
- Sunspot number and F10.7 flux by calendar year (CSV): the yearly average sunspot number, change on the previous year, the highest and lowest monthly sunspot number of the year and the yearly average, high and low of the F10.7 radio flux for 2008 to 2025 (18 years).
Every month since January 2008 is on the Solar Cycle 25 tracker. The sunspot numbers come from WDC-SILSO, Royal Observatory of Belgium, which distributes them under a CC BY-NC 4.0 licence (SILSO data policy). You may reuse these files for non-commercial purposes with credit to PolarisWire and WDC-SILSO, Royal Observatory of Belgium, and a link to this page.
Cite this page
You are welcome to quote any statistic here with a link to this page. Each figure has its own link (the # after it) so you can point readers to the exact number, and a "Copy citation" button that copies the figure with its source and link.
Embed the latest sunspot number
Copy this HTML to show the latest monthly sunspot number on your own site or newsletter. It is plain HTML with no scripts. The figure is fixed when you copy it, so copy it again after a newer monthly release. Please keep the credit link.
How these figures are calculated
All figures use the monthly mean international sunspot number (version 2) from the World Data Center SILSO at the Royal Observatory of Belgium and the monthly 10.7 cm solar radio flux (F10.7) measured by the National Research Council of Canada, both as published by the NOAA Space Weather Prediction Center, from January 2008 onward. F10.7 is given in solar flux units (sfu).
Solar Cycle 24 is counted from December 2008 and Solar Cycle 25 from December 2019, the solar minimums used by SILSO and the NOAA–NASA prediction panel. The 13-month smoothed sunspot number uses the standard SILSO formula: the average of the 13 months centred on each month, with the first and last months at half weight, so the latest smoothed value trails the newest month by six months. Yearly figures are simple averages of the monthly values. Averages, records, smoothed values and comparisons are calculated by PolarisWire. SILSO may revise recent months, and this page is updated daily from NOAA's latest file. Please credit WDC-SILSO, Royal Observatory of Belgium, when reusing the sunspot numbers.